top of page
Search

ES Weekly View (Jan 21-24)

Yearly Analysis:

  • The market maintains its bullish stance, with ES prices consistently trading above the 2024 Value High after it revisited 2024 Value High at 5808-5815 zone.


  • The One Time Frame Up (OTFU) pattern continues to dominate, signaling sustained upward momentum.


Monthly Analysis:

  • The ES market has maintained a balanced state for the past four months.

  • Initially, the January 2025 profile also indicated equilibrium. However, buyers successfully propelled ES beyond January’s Value High after revisiting the lower distribution from November 2024.


  • This rebound marked a turning point, as ES quickly gained upward momentum, driving the market to hit January 2025’s High. Our focus now shifts to the next target: 6133.


ree

Weekly Analysis:

  • The Market Profile from last week painted a bullish picture for ES, showcasing an uptrend with a double distribution—an indicator of sustained positive momentum heading into this week.


  • To keep the bullish narrative intact, buyers must hold the critical support zone between 6000 and 6018 while pressing to breach the upper boundary of the three-week balance.


  • Our eyes remain firmly set on the next target for ES: 6133.


ree


Daily Analysis:


  • Last week brought a compelling narrative for ES, marked by resilience in the face of bearish sentiment. Concerns of a market crash, fueled by the emergence of a head-and-shoulders pattern and five consecutive days of one-time-frame down (OTFD) activity, were temporarily eased as the market entered a three-day balance early in the week.


  • Wednesday Jan 15, 2025 saw a decisive directional move that left an unfilled gap between 5910 and 5951. By Thursday, the market settled into a two-day balance, only to reignite its upward momentum on Friday. This rally resulted in another unfilled gap (6005-6013) after several failed attempts to close it. The inability to fill these gaps would underscore market strength.


  • Monday, January 20, 2025, marked a momentous day as Martin Luther King Jr. Day aligned with the Presidential Inauguration, underscoring its significance in January's trading calendar. At the market’s opening bell, buyers attempted to break ES out of a three-week balance and push it into the higher distribution area outlined in the December 12 weekly profile. Their efforts were thwarted by sellers, who decisively regained control and dragged ES back into its established balance range, setting the stage for a fierce tug-of-war between market participants.


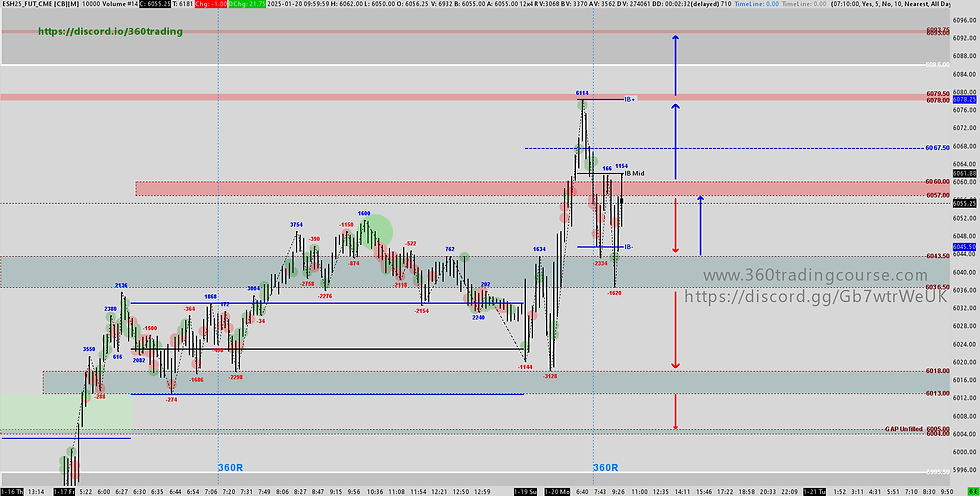
  • The 6036-6043 range emerges as a pivotal technical zone, reflecting a confluence of multiple days’ TPOs, Value Area High (VAH), Value Area Low (VAL), and Single Print levels. A sustained move above 6043 would pave the way toward 6057-6060, with a firm acceptance beyond this threshold unlocking potential upside to 6080. Should buying momentum remain strong, the market could extend gains to 6086 and eventually 6093.


  • Conversely, a failure to hold above 6036 would shift the focus to the gap at 6005-6013, making it a key target for sellers. If selling pressure intensifies, last week’s Point of Control (POC) at 5987-5989 will serve as a critical benchmark, providing essential clues about the potential for deeper downside moves.

  • ES 1/21/25 Key Levels (Please adjust the level after ETH session to have better accuracy)
    ES 1/21/25 Key Levels (Please adjust the level after ETH session to have better accuracy)


Comments


White Structure

360 TRADING ACADEMY

       California | South Carolina | Texas

       360trading.llc@gmail.com

FOLLOW

  • Facebook
  • X
  • Youtube
  • Discord

TRADING RISK DISCLOSURE: 360 Trading Academy or any related entity is not registered as an investment adviser or a broker/dealer with either the CFTC, NFA or any futures and securities authority. Users of this website and service are advised that all information presented is used solely for information and education purposes, is not intended to be used as a personalized investment recommendation and is not attuned to any specific portfolio or to any user's particular investment needs or objectives. Any advisory, signal, presentation or video generated by 360 Trading Academy is provided for education purposes only. Any trades placed upon reliance on Trading Ideas and Daily Plans are taken at your own risk for your own account. Past performance is no guarantee of future results. While there is great potential for reward trading futures and stocks, there is also substantial risk of loss in all trading. You must decide your own suitability to trade or not. Futures results can never be guaranteed. This is not an offer to buy or sell futures or commodity interests. To the fullest extent of the law, 360-Trading LLC or any associates in the group will not be liable to any person or entity for the quality, accuracy, completeness, reliability, or timeliness of the information provided on this site or for any direct, indirect, consequential, incidental, special or punitive damages that may arise out of the use of information the group provides to any person or entity (including, but not limited to, lost profits, loss of opportunities, trading losses, and damages that may result from any inaccuracy or incompleteness of this information).   CFTC RULE 4.41: Hypothetical or Simulated performance results have certain limitations. Unlike an actual performance record, simulated results do not represent actual trading. Also, because the trades have not actually been executed, the results may have under-or-over compensated for the impact, if any, of certain market factors, such as lack of liquidity. Simulated trading programs, in general, are also subject to the fact that they are designed with the benefit of hindsight. No representation is being made that any account will or is likely to achieve profit or losses similar to those shown. Testimonials appearing on this website may not be representative of other clients or customers and is not a guarantee of future performance or success. No representation is being made that any evaluation account will achieve profit or losses similar to those shown here. U.S. GOVERNMENT REQUIRED DISCLAIMER - COMMODITY FUTURES TRADING COMMISSION: Futures and Options trading have large potential rewards, but also large potential risk. You must be aware of the risks and be willing to accept them in order to invest in the futures and options markets. Don't trade with money you can't afford to lose. This is neither a solicitation nor an offer to buy/sell futures or options. No representation is being made that any account will or is likely to achieve profits or losses similar as those discussed on any videos or posts. The past performance of any trading system or methodology is not necessarily indicative of future results. No representation is being made that any account will or is likely to achieve similar profits depicted in any presentation or performance report.

bottom of page