top of page
Search

Vistra (Ticker: VST) in Utilities Sector -Trade Idea for Swing/Long Term Trade

UTILITIES SECTOR

Company: Vistra (VST)

Price Target: $210


Vistra Energy stands as one of the foremost power producers and retail energy providers in the United States. With its landmark acquisition of Energy Harbor in 2024, Vistra now commands an impressive 41-gigawatt portfolio spanning nuclear, coal, natural gas, and solar power generation. Moreover, the company boasts ownership of one of the most significant utility-scale battery projects globally, reinforcing its position at the forefront of energy innovation.


Vistra Energy reported strong third-quarter results, accompanied by upward revisions to its guidance for 2024 and 2025, and signaled potential upside for 2026 targets.


The company’s nuclear contracting efforts, particularly with data centers, are progressing smoothly, with the Comanche Peak plant in Texas seeing robust demand.


Vistra also revealed a greater-than-expected volume of contracting opportunities spanning nuclear and gas assets, across PJM and ERCOT markets, and involving both established facilities and new developments. Investors can anticipate several catalysts driving momentum before the close of the year.


Technical Analysis

Vistra Energy’s technical outlook is deteriorating, with overall momentum decelerating and a heightened risk of further declines if key support levels fail to hold.


Despite outperforming the S&P 500 over the last 50 trading days, a close below the $144.01 threshold would signal a definitive trend reversal. While upside momentum, reflected by the 9-day RSI, remains in positive territory, it is beginning to lose steam.


Additionally, the stock appears overbought, as evidenced by a Slow %K stochastic reading exceeding 80.


On the positive side, trading volume over the past 50 sessions shows accumulation, with higher activity on up days compared to down days. The stock continues to trade above its rising 50-day moving average, a critical support level. Should this level give way, heightened selling pressure could ensue, with secondary support potentially emerging at the rising 200-day moving average.


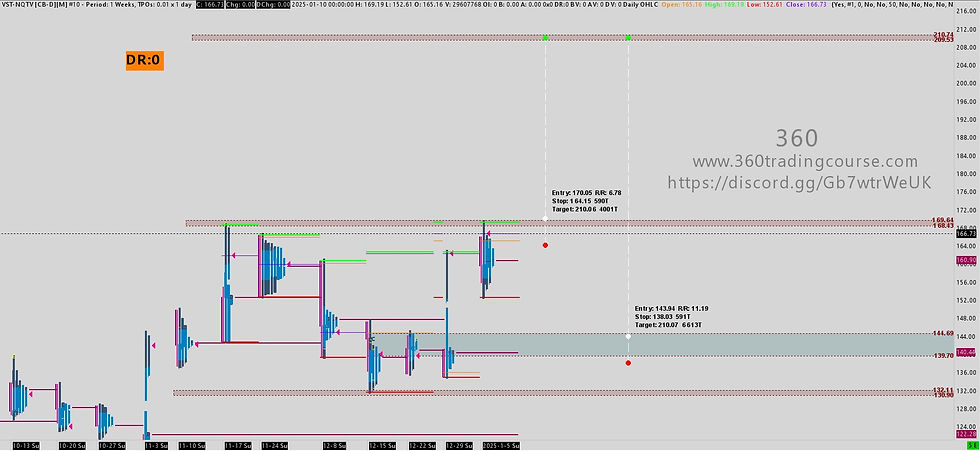
  1. Break out ATH is on scenario. If it does, wait for pull back and with high buy volume, you can add position


  2. Wait for pull back to buy at the 2nd location, then you can add your position. See Chart Below


Comentarios


White Structure

360 TRADING ACADEMY

       California | South Carolina | Texas

       360trading.llc@gmail.com

FOLLOW

  • Facebook
  • X
  • Youtube
  • Discord

TRADING RISK DISCLOSURE: 360 Trading Academy or any related entity is not registered as an investment adviser or a broker/dealer with either the CFTC, NFA or any futures and securities authority. Users of this website and service are advised that all information presented is used solely for information and education purposes, is not intended to be used as a personalized investment recommendation and is not attuned to any specific portfolio or to any user's particular investment needs or objectives. Any advisory, signal, presentation or video generated by 360 Trading Academy is provided for education purposes only. Any trades placed upon reliance on Trading Ideas and Daily Plans are taken at your own risk for your own account. Past performance is no guarantee of future results. While there is great potential for reward trading futures and stocks, there is also substantial risk of loss in all trading. You must decide your own suitability to trade or not. Futures results can never be guaranteed. This is not an offer to buy or sell futures or commodity interests. To the fullest extent of the law, 360-Trading LLC or any associates in the group will not be liable to any person or entity for the quality, accuracy, completeness, reliability, or timeliness of the information provided on this site or for any direct, indirect, consequential, incidental, special or punitive damages that may arise out of the use of information the group provides to any person or entity (including, but not limited to, lost profits, loss of opportunities, trading losses, and damages that may result from any inaccuracy or incompleteness of this information).   CFTC RULE 4.41: Hypothetical or Simulated performance results have certain limitations. Unlike an actual performance record, simulated results do not represent actual trading. Also, because the trades have not actually been executed, the results may have under-or-over compensated for the impact, if any, of certain market factors, such as lack of liquidity. Simulated trading programs, in general, are also subject to the fact that they are designed with the benefit of hindsight. No representation is being made that any account will or is likely to achieve profit or losses similar to those shown. Testimonials appearing on this website may not be representative of other clients or customers and is not a guarantee of future performance or success. No representation is being made that any evaluation account will achieve profit or losses similar to those shown here. U.S. GOVERNMENT REQUIRED DISCLAIMER - COMMODITY FUTURES TRADING COMMISSION: Futures and Options trading have large potential rewards, but also large potential risk. You must be aware of the risks and be willing to accept them in order to invest in the futures and options markets. Don't trade with money you can't afford to lose. This is neither a solicitation nor an offer to buy/sell futures or options. No representation is being made that any account will or is likely to achieve profits or losses similar as those discussed on any videos or posts. The past performance of any trading system or methodology is not necessarily indicative of future results. No representation is being made that any account will or is likely to achieve similar profits depicted in any presentation or performance report.

bottom of page